Traffic violations in Bishkek
Bishkek is the capital of Kyrgyzstan and, like many other cities around the world, it faces challenges related to traffic violations. Traffic violations can have a significant impact on road safety, traffic flow, and the environment.
Traffic violation data analysis can help to evaluate the effectiveness of existing traffic safety interventions. So, in this blog post, I will analyze the data to better understand the situation.
A bit about the data set
I gathered the data from the Open Data Platform of Kyrgyzstan. The data set is constucted from these excel sheets. The available1 period is from 01.09.2019 - 30.04.2021. The provided information:
id- unique identification number of the violationcar_brand- vehicle brandcar_model- vehicle modelviolation_date- the date of the violationcrossroad_name- the location (street) of the violationviolation_protocol_name- violation nameviolation_ammount2 - violation amount (fine in KGS)
I do not know how the data was collected. Hence, I cannot guarantee that it is reliable. So, treat the findings with a grain of salt.
Of course it would be great if we had more information such as: gender, age, etc.
Some basic questions3
What is the most frequent traffic violation?
To answer this question we can make a horizontal bar plot.
[ To enlarge the images click on the them! ]
We see that “Exceeding the speed limit by more than 10 km/h, but not more than 20 km/h” dominates with almost 50% of all the cases. Moreover, the fine for this violation type consist of 1000 KGS.
It would be interesting also to have crash reports - reports which include information on traffic accidents, including the causes of the accident, the vehicles involved, and any injuries or fatalities.
Thus, we expect that the most frequent fine is 1000 KGS. Which is confirmed in the figure below.
The collected fine is distributed as follows [source]: “Vega” company receives about 215-216 KGS from each violation, then 2.6 million KGS for technical support of the “Safe City” system, on which operators of the Monitoring Center process data.
The distribution of the rest of the funds:
- 5% to the State Committee of National Security for the maintenance and servicing of the backup data processing center;
- About 25% to the mayor’s office, local authorities for the creation of road infrastructure, installation of markings, signs and other things;
- 5% cent to the Ministry of Transport and Roads for the creation of road infrastructure conditions
- About 15% to the Main Directorate for Road Safety for creating conditions for patrol cars, the operation of the Monitoring Center, payment for the work of its operators.
Besides, I am not sure if all of the cases were confirmed by an operator.
What about the cars?
First, let’s look at the car brands.
The top-3 cars are: Toyota, Honda and Mercedes-Benz respectively.
Is it just because these brands are the most common in Bishkek?
Here it was reported4 that the top-5 cars in Kyrgyzstan by number are:
- Mercedes-Benz (141 618)
- Daewoo (139 406)
- AvtoVAZ (137 485)
- Toyota (128 672)
- Honda (118 722)
So, at least they are among the five most popular cars. But it is better to confirm it by youself.
Second, more in detail - including the car models:
We have two leaders: Honda Fit and Toyota Camry.
Locations
Now, it is interesting to look at the locations that have the highest incidence of traffic violations.
There is a clear leader: Zhibek-Zholu 291
Let’s look more closely on top-5 crossroads by projecting them on the map. Along with the top-5 car models for each of the selected crossroads.
Ideally, traffic violation data analysis can help to identify high-risk areas where accidents are more likely to occur due to traffic violations. By understanding where and why violations are occurring, authorities can take steps to improve safety in these areas.
Every day in a year
For this I plotted heatmaps in a calendar format.
We observe that cold months have less incidents than warm ones. There is a clear deacrease/increase in number of violations as we approach winter/summer.
The data for the year 2020 shows an unusual trend in the months of March and July, with a high number of violations in March and a low number in July. This leads to the question of whether this could be related to the COVID-19 lockdown measures.
Every hour in a day
Here I plotted number of traffic violations in 24 hours. For all the years aggregated and separately for each year.
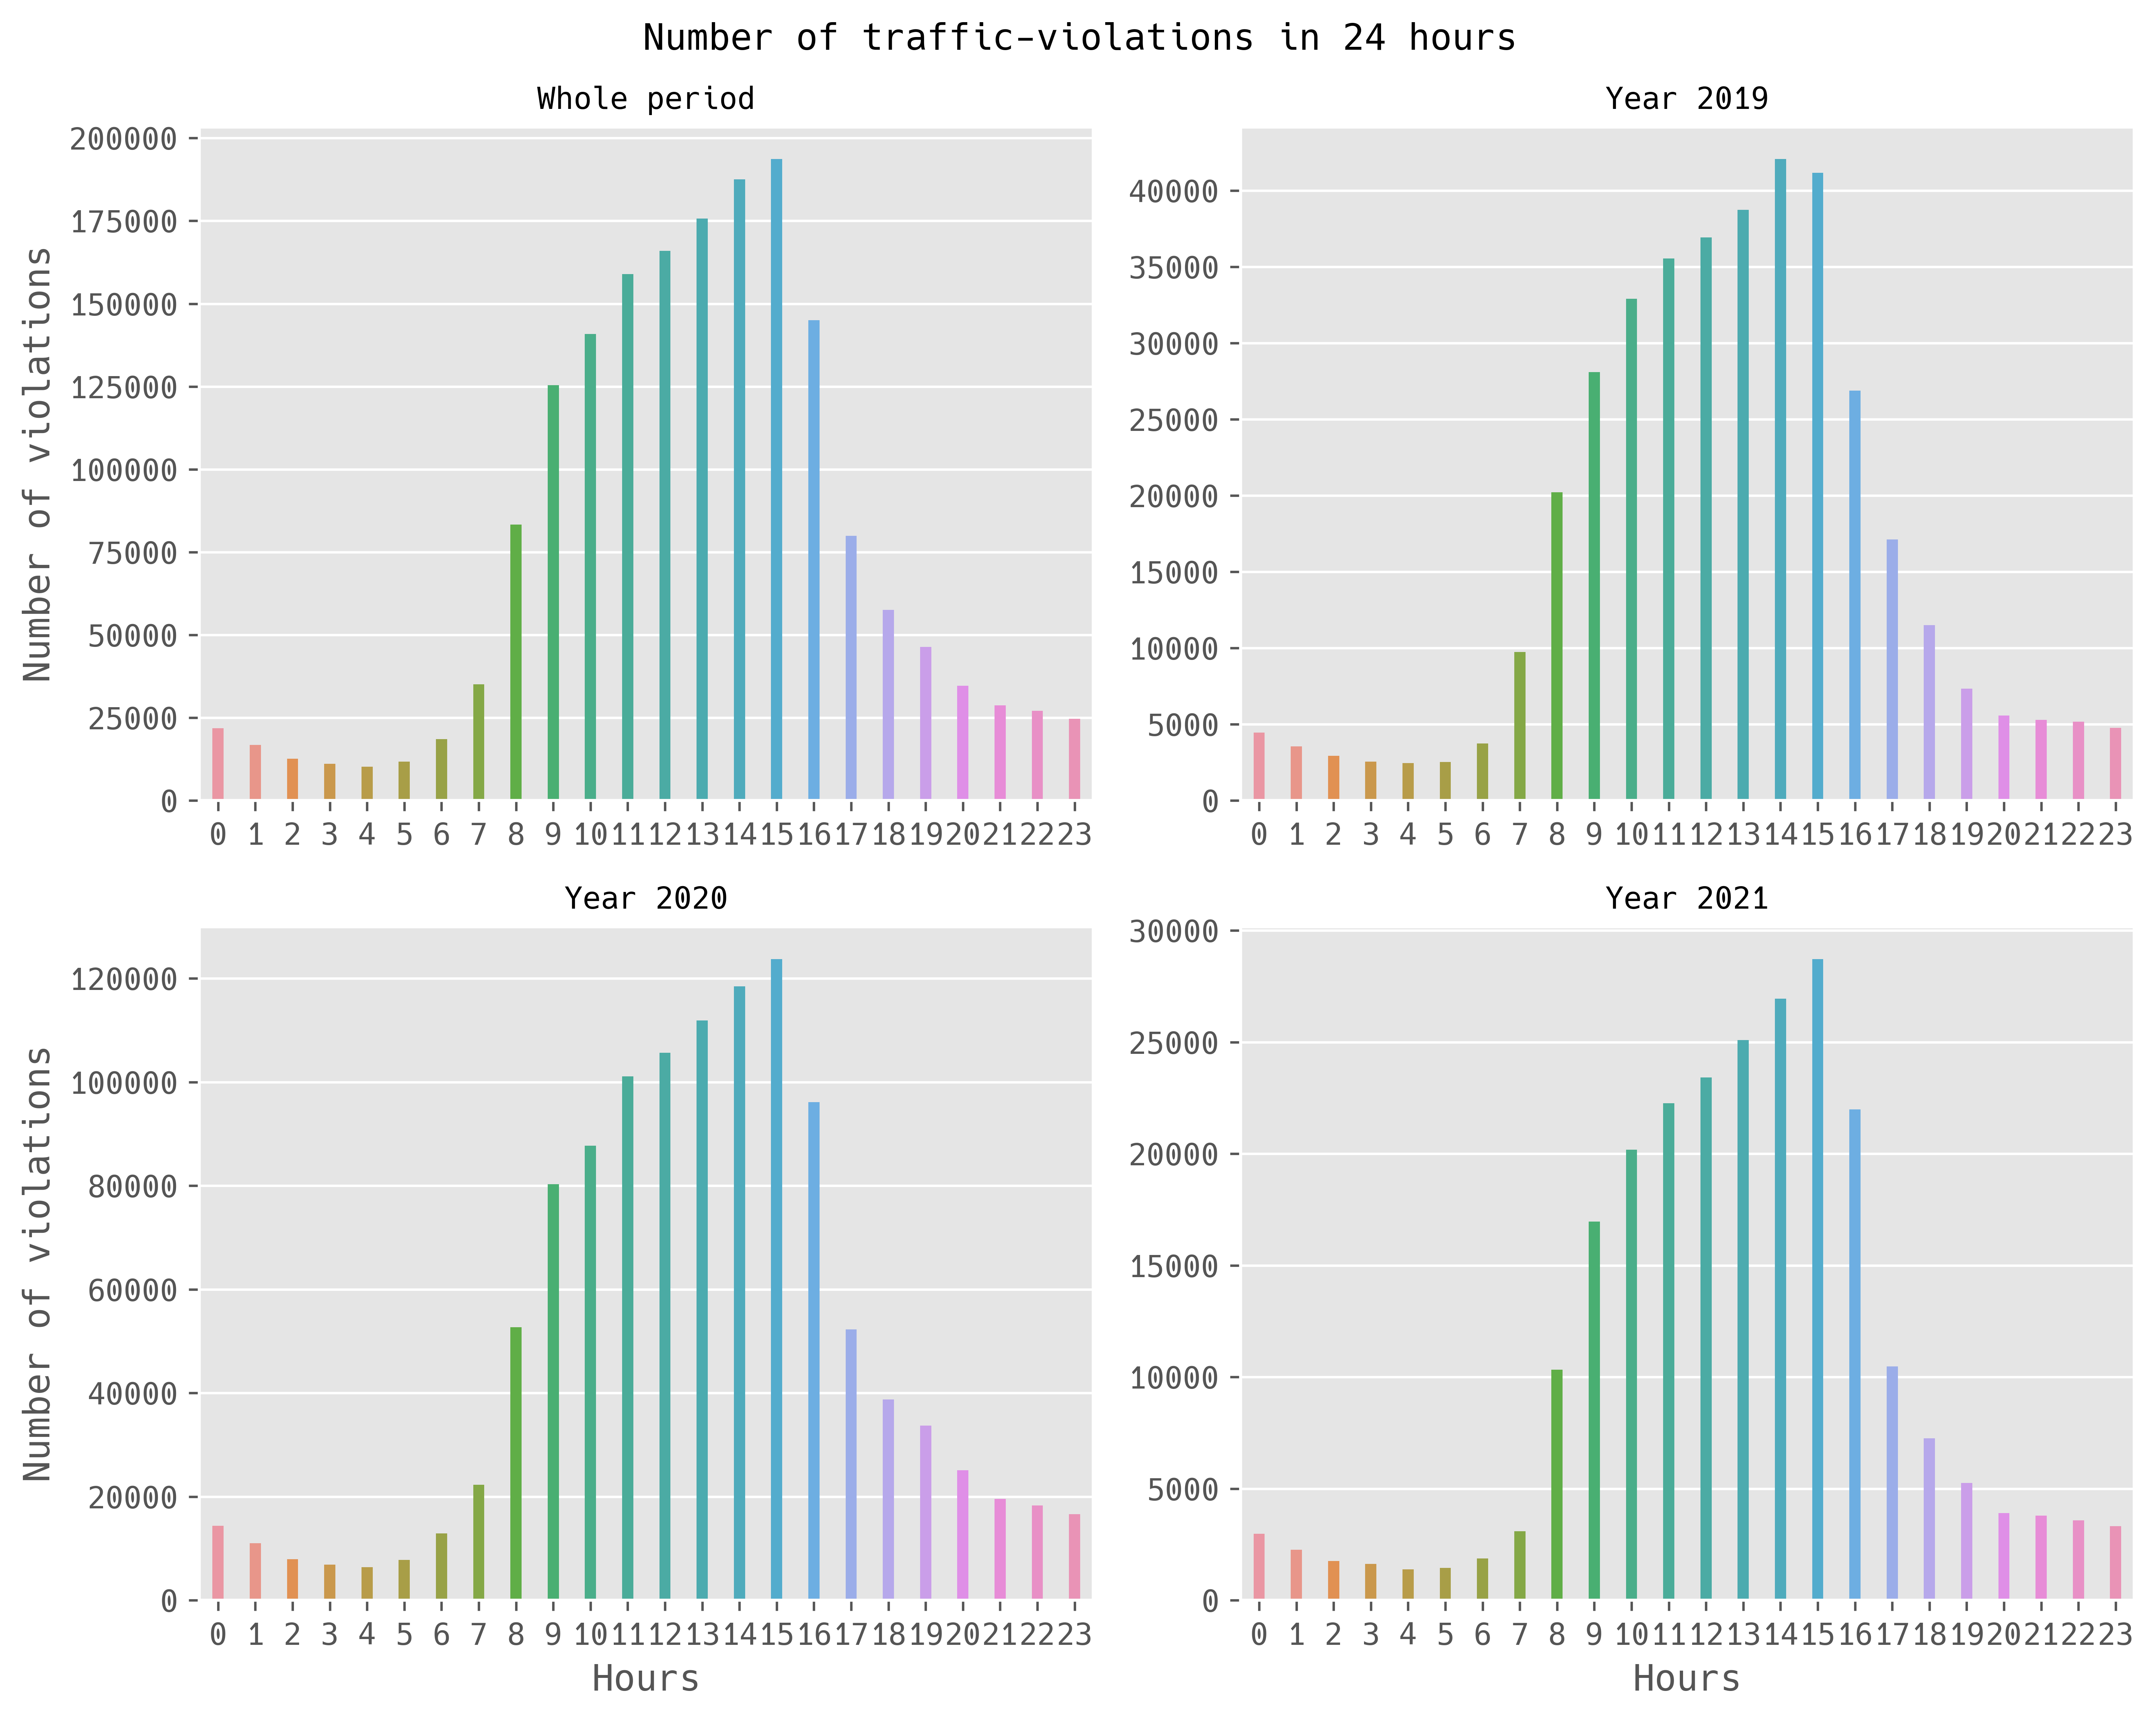
The highest numbers are around 14-15 hours. Interestingly, the pattern remains consistent across all the years.
By monitoring changes in traffic violation rates over time, authorities can determine whether interventions such as education campaigns or enforcement initiatives are having a positive impact.
Reproducibility
The code with the analysis is in this repo. You can generate all the tables and figures presented in this post yourself.
Please feel free to comment. And if you have any questions, contact me.