Physics 10
Aidin Biibosunov
Created: 2024-09-04 Wed 17:54
1. Week 1
1.1. Lesson 1: Кинематика
1.1.1. Introduction to Kinematics (5 minutes)
- Definition: Briefly define kinematics as the study of motion without considering the forces causing it.
- Key Concepts: Introduce position, velocity, and acceleration.
#### 2. Position-Time and Velocity-Time Graphs (10 minutes)
- Position-Time Graph:
- Explanation: Discuss how the slope of a position-time graph represents velocity.
- Plot Example:
- Show a graph where a straight line indicates constant velocity.
- Discuss how different slopes represent different velocities.
- Velocity-Time Graph:
- Explanation: Explain that the slope of a velocity-time graph represents acceleration.
- Plot Example:
- Show a graph where a horizontal line indicates constant velocity (zero acceleration).
- Discuss a sloped line representing constant acceleration.
#### 3. Equations of Motion (15 minutes)
- Introduction:
- Present the three main equations of motion:
- \(v = u + at\)
- \(s = ut + \frac{1}{2}at^2\)
- \(v^2 = u^2 + 2as\)
- Present the three main equations of motion:
- Deriving from Graphs:
- Use the velocity-time graph to derive the first equation.
- Discuss how area under the velocity-time graph relates to displacement.
- Plot Examples:
- Show a velocity-time graph for uniformly accelerated motion.
- Use it to visually derive the equations, emphasizing the relationships between different quantities.
#### 4. Real-Life Application and Example Problem (10 minutes)
- Real-Life Application:
- Discuss how these concepts apply to everyday scenarios, such as a car accelerating from a stoplight.
- Example Problem:
- Problem: A car accelerates from rest at \(2 \, \text{m/s}^2\) for 5 seconds. Calculate the final velocity and the distance traveled.
- Solution:
- Use \(v = u + at\) to find the final velocity.
- Use \(s = ut + \frac{1}{2}at^2\) to find the distance.
- Plot:
- Plot the velocity-time graph for the car’s motion.
#### 5. Quick Assessment (5 minutes)
- Quiz Questions:
- Multiple-choice questions on interpreting position-time and velocity-time graphs.
- Short problems involving equations of motion.
- Discussion: Go over the answers briefly to ensure understanding.
#### 6. Conclusion and Homework Assignment (5 minutes)
- Summary: Recap the key points of the lesson, emphasizing the relationship between the graphs and the equations of motion.
Homework: Assign a problem set that includes interpreting motion graphs and applying the equations of motion to different scenarios.
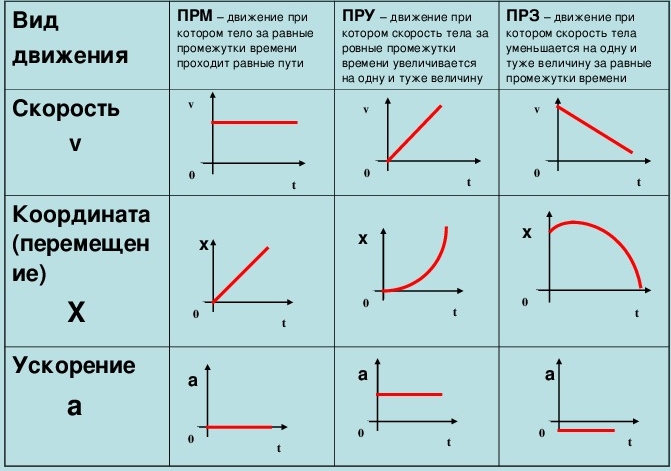
Here are the plots for the kinematics lesson:
- Position-Time Graph: This graph shows a straight line, representing constant velocity. The slope of the line indicates the speed of the object.
- Velocity-Time Graph: This graph shows a scenario with three phases:
- Acceleration: The velocity increases over time.
- Constant Velocity: The velocity remains steady.
- Deceleration: The velocity decreases, eventually reaching zero.
These visual aids will help students understand the relationship between motion, time, and velocity.
1.2. Важно
- Проверять ответы на здравый смысл